The source code of what I have accomplished cannot be published here, but screenshots can be provided to accompany the explanations.
Achievements
During this internship, I had the opportunity to participate in two projects. The first was drafting the response to the tender, and the second was my mission at Colissimo with the “Webhook” project.
1 - Contribution to the Tender Response
We will explore the achievements made for the tender response.
Data Generation
Preliminary Exploration for Generation
I gathered information from various French and international associations, directly from their websites or third-party sites like Kaggle. By collecting this information, I was able to determine what was necessary and what was not for our case.
I found the average amount that associations receive for one-time and regular payments. The percentage of donations that are regular and one-time payments, with an average of $100 for a one-time donation and $50 for a regular donation in the United States.
And the different frequently used payment methods such as checks, bank transfers, cash, or credit/debit cards. I noticed a recent change with the democratization of the internet and online purchases. For example, in France, in 2010, 23% of French people donated online compared to 28% in 2020. This trend is present in most age categories but is more pronounced for people under 35, with 28% donating online, an increase of 13% compared to 2010.
Additionally, the average age of donors in the United States is 64 years and in France is 62 years, so it is necessary to show this disparity with the age of donors.
I sought to limit the origin of donations to specific regions; in our case, I chose Europe and North America. These geographic areas are interesting as they have a certain level of similar wealth between the two regions but quite pronounced disparities within these regions, for example, the disparity between the United States and Mexico, and between Western and Eastern Europe. To represent these disparities between countries, I used the GDP per capita of each country and normalized it relative to the United States, meaning that with a GDP per capita of about $76,000, the United States has a value of 1.00, and Mexico with a GDP per capita of about $11,500 has a value of 0.15. These values are used as multipliers for donations from the countries.
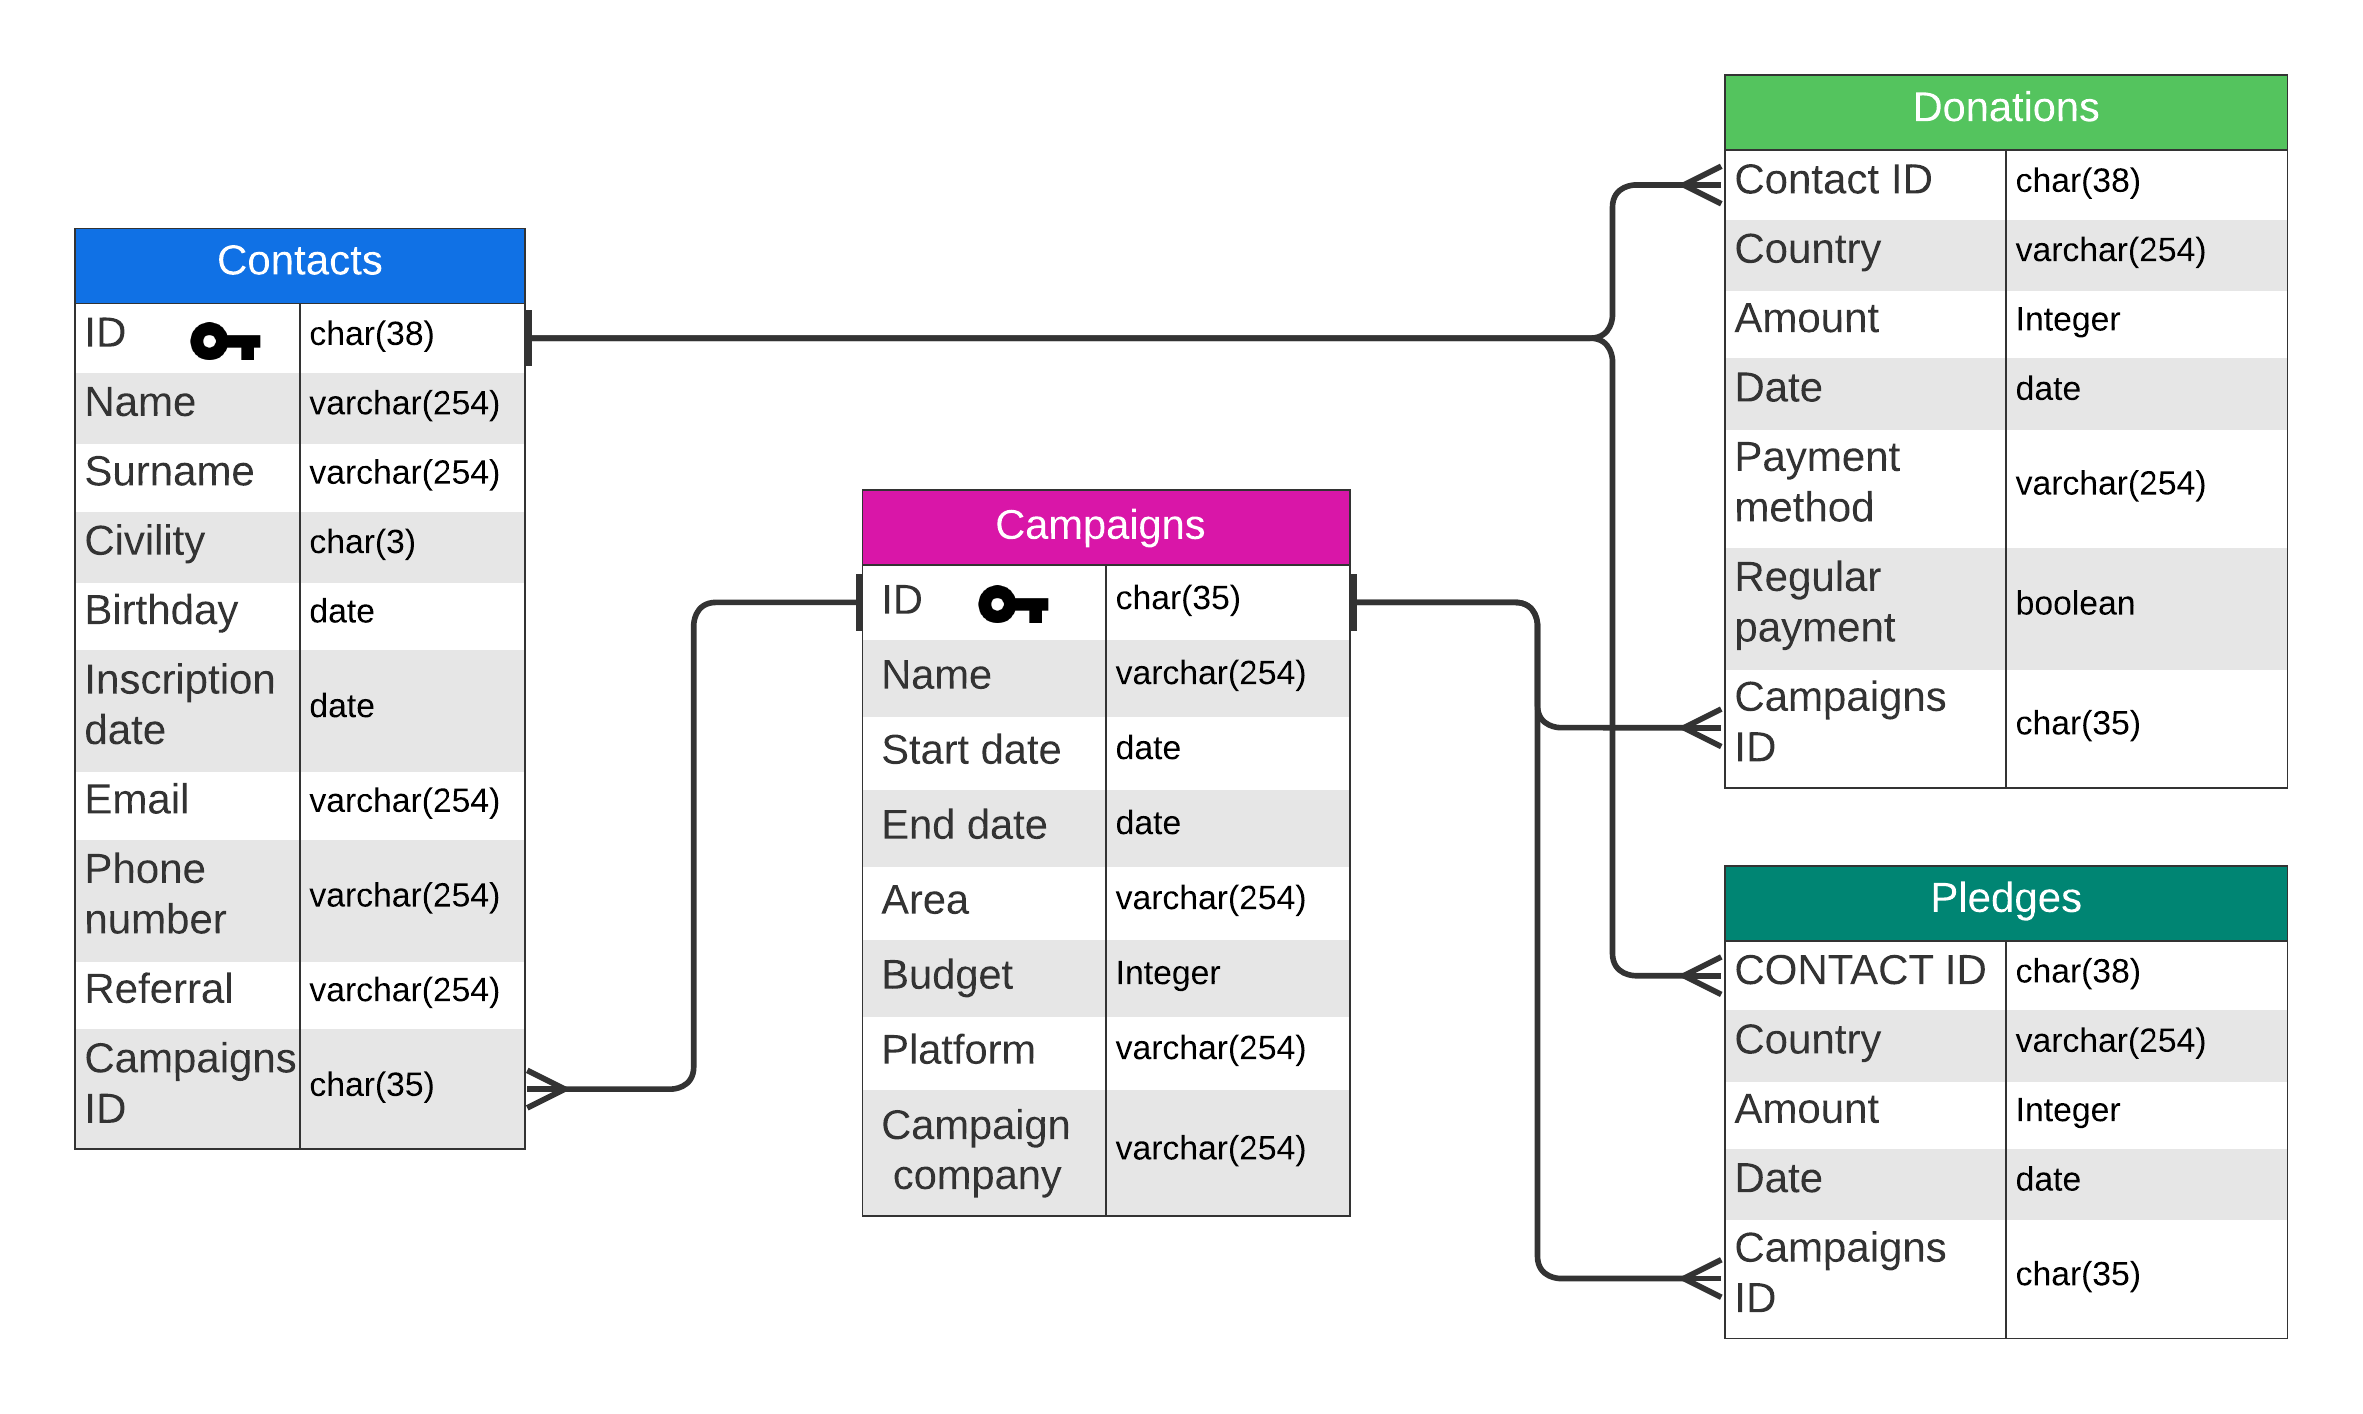
The different metrics used are relevant, but I did not consider inequalities within the same country. For this, I used a metric often used in statistics, the Gini coefficient. The Gini coefficient/index is a measure of the distribution and allocation of a value, in our case, wealth. The Gini index ranges from 0 to 1, with a coefficient of 0 corresponding to perfect equality where the distribution of the variable is equal for all, and 1 corresponding to absolute inequality where the distribution of the value is allocated to a single individual. This factor is used to accentuate the maximum and minimum donations. Once this information was gathered, I was able to develop this database:
Python for Data Generation
To generate this data, I used Python with the “Faker” library, which is inspired by the library of the same name in Ruby. Python is often used for data science, so there are various libraries for generating synthetic data. I used the “Faker” library for this project. Faker is a Python library for generating fake but realistic data. The advantages of Faker over other libraries are as follows:
Localization, meaning the adaptation of the library’s generators to different countries, in our case, generating first names and last names for the contacts table.
Variety, there are different generators available for names, first names, birth dates, or addresses.
Customizable, the different generators can be modified, and the possibility of creating new generators is given to the user.
On-site, no generation limits compared to online APIs, entirely generated on the local machine.
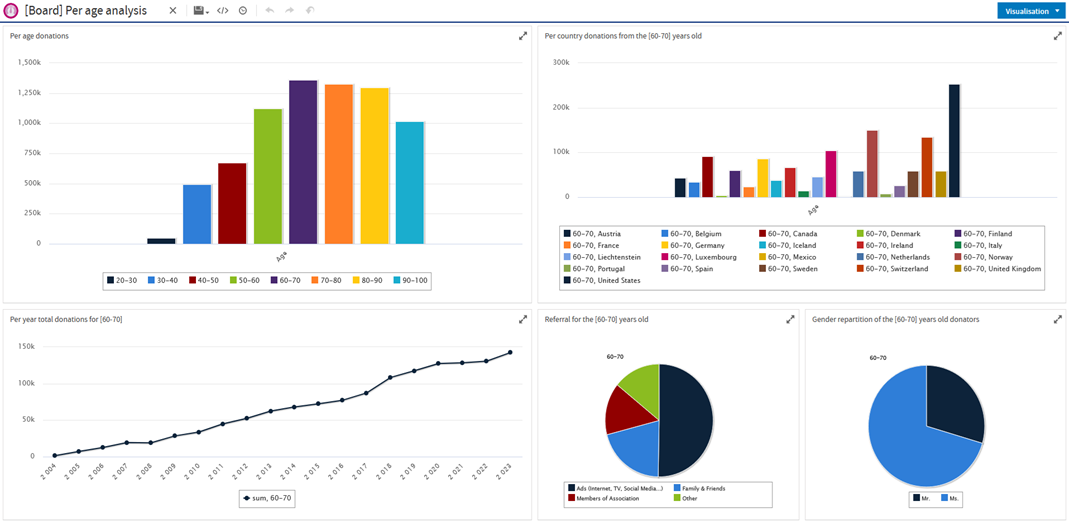
I also explored the tools offered by Jaspersoft. We had access to a Jaspersoft Server with a server on Azure VM. Jaspersoft Server allows for the creation of interactive dashboards and reports. For Jaspersoft tools, we have the possibility to connect different data sources ranging from CSV files to databases with JDBC connections. In our case, with the star schema database stored in PostgreSQL, we use the JDBC connection to connect our database to exploit it. On Jaspersoft Server, the interface is user-friendly with a modern interface and documentation and tutorials allowing for quick learning and rapid mastery. Jaspersoft Server allows for the creation of dynamic charts that change based on user actions, with components provided by Jaspersoft. We also discovered limitations with the tool in terms of dashboard customization; we cannot edit the titles of components or the color of graphs. We had a time constraint that prevented us from exploring all the possibilities with Jaspersoft Studio.
Example of a dashboard on Jaspersoft Server:
Jaspersoft Studio allows for the creation of static reports that can be filled with existing components and fed with the data we provide. Similar to Jaspersoft Server, we connected our database with a JDBC connection. Jaspersoft Studio focuses on the development of static reports that can be done in batch.
Continuation of the Project
Unfortunately, we were not selected by ESCP, but we decided to continue the project to evaluate the shortcomings we might have had and the integration of a data warehousing solution, Snowflake.
Snowflake is a cloud data warehousing platform that offers a wide range of tools for managing data analysis and the necessary storage space on a large scale. It is deployable on several popular cloud platforms such as AWS, Azure, and GCP for flexibility and redundancy. It is also easily scalable depending on the workload and independently for storage and processing capacity. We were able to easily integrate Snowflake with Jaspersoft, as Jaspersoft offers an integrated tool allowing it.
During the tender response, we focused on the interactive dashboards offered by Jaspersoft Server and had neglected Jaspersoft Studio, but we discovered an interesting feature for an organization like ESCP. The option to automatically send reports that have been created by email and receive email sending confirmation notifications. For a school where a large number of documents need to be produced and sent to students, these options are relevant and could be the reason for selecting another firm. Once finished, I was informed of my mission and the technologies I would use to accomplish it.
2 - Contribution to the Project
We will explore the various tasks carried out for the “Webhook” project.
Personal Contributions
Consultation of User Stories
I first consulted the various user stories of the “Webhook” project and other projects to understand the context and functional aspects. I also attended meetings where my internship supervisor discussed updates to the user stories with the product manager.
Message Mapping
One of the first tasks assigned to me was to perform message mapping. This involved retrieving a message in a given format and converting it into another format to send it to another component.
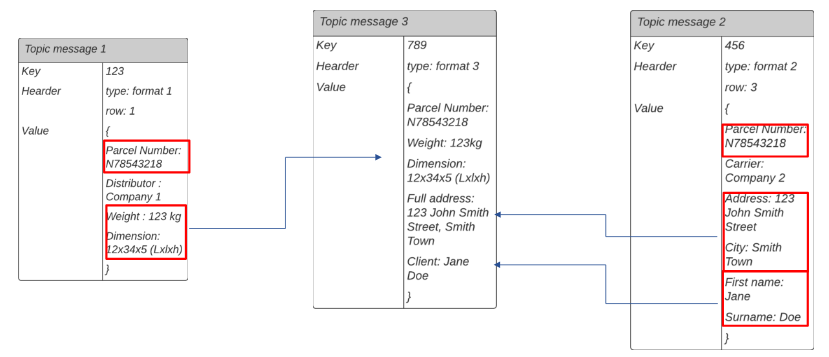
Example of message mapping
In this example, we initially have two messages, “Topic message 1” and “Topic message 2,” from which we want to extract information. This information will be used to create a new message, “Topic message 3.”
The two initial messages, “Topic message 1” and “Topic message 2,” are retrieved using the parcel number (“Parcel Number”) as a common identifier.
Once these messages are retrieved, the necessary information is extracted from each of them.
The extracted information is then combined to create the new message, “Topic message 3.”
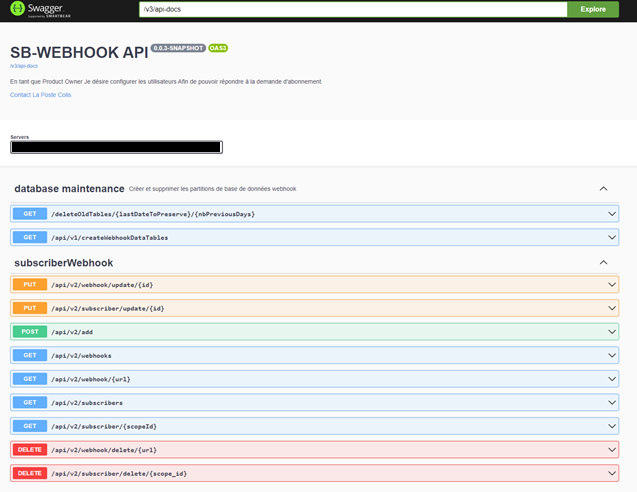
Adding Features with Swagger
I added features to the Swagger API, an open-source solution used for the development and documentation of REST APIs. Since our application is developed with Spring Boot, Swagger can be used to document the various routes, methods, parameters, and responses of the API.
The added features include:
Adding new “webhooks” and associated “subscribers.”
Deleting “webhooks” and “subscribers.”
Modifying and updating existing “webhooks” and “subscribers.”
The ability to view all “webhooks” and all “subscribers.”
The ability to view a specific “webhook” from an ID or URL, and the same for “subscribers.”
Implementation of Technical Replay
I also implemented technical replay, which involves resending messages that were not correctly sent due to server access issues or other problems that might occur. Additionally, it can be used as a testing tool to check for the existence of a bug.
Development of Tests
I developed a suite of unit and integration tests. Unit tests were conducted using JUnit and Mockito, ensuring that each individual component worked as expected. Integration tests were set up to validate the interaction between different modules of the system.
I carried out the deployment of various projects in the appropriate environments using the available deployment pipelines.
Skills Developed
With these contributions, I learned a lot and developed many skills. By working on user stories, I gained a deep understanding of how user needs translate into technical features. By working more on Spring Boot, I reinforced what I learned during my training and the implementations of the framework in a professional environment.