Impact Study
This feature allows for visualizing the impact of a variable, that is, the influences of variables on each other. It thus enables observing the consequences of modifying one or more variables on the others.
The interface consists solely of the “Impact Study” tab with the “Modeling” and “Summary” panels. In the “Modeling” panel, you will find the sub-panels “Impact Study Selection” and “Variable Impact.”
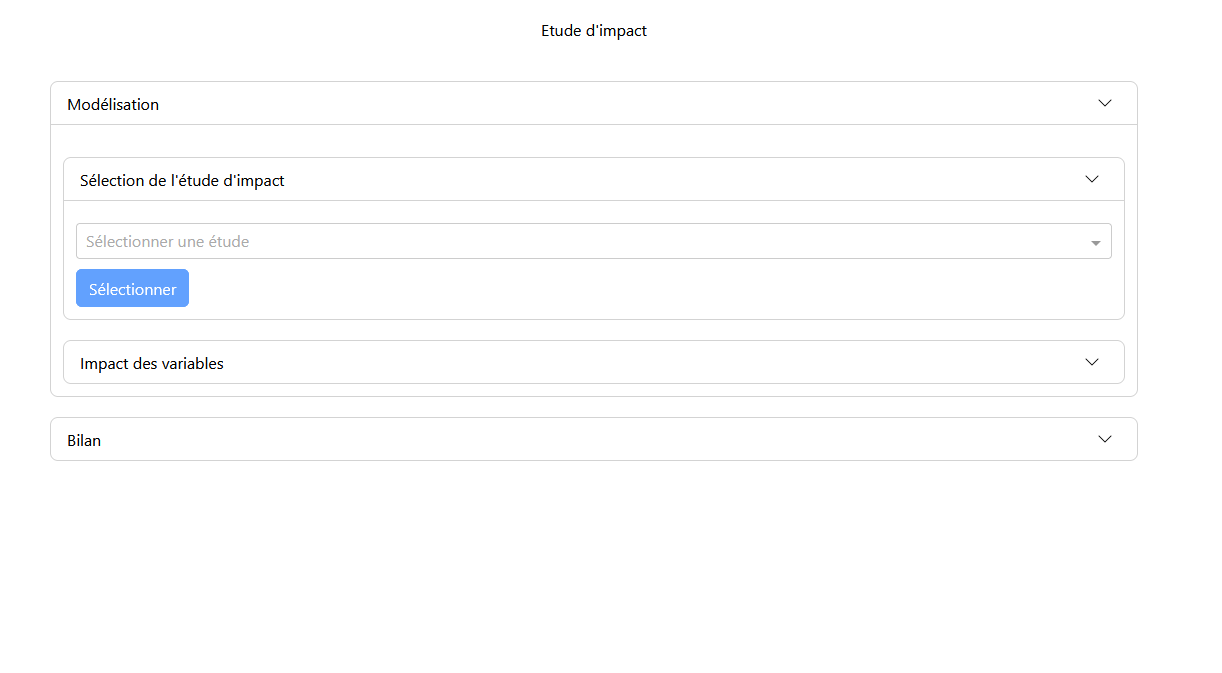
Selection Panel
In the selection panel, the user chooses the desired impact study. Once the study is selected, the modeling is displayed in the modeling panel.
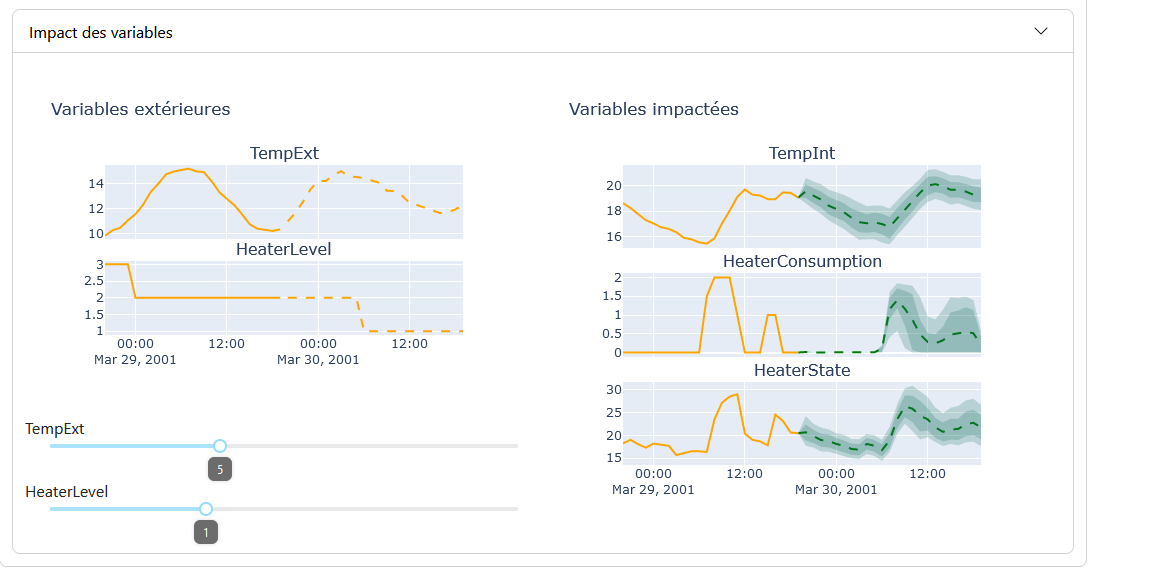
Modeling Panel
The modeling of the impact study is presented in two parts:
- External Variables: These are the hypothesis variables that influence the impacted variables. They are adjusted via sliders.
- Impacted Variables: These are the variables that change based on the external/hypothesis variables.
With each modification of the values of the external variables, the graphs of the impacted variables are regenerated. The modeling graphs are similar to those of the “Forecast Modeling” feature, with a few differences: for the graphs of the hypothesis variables, the part of the graph with prediction and uncertainty is replaced by a section representing the values set by the sliders.
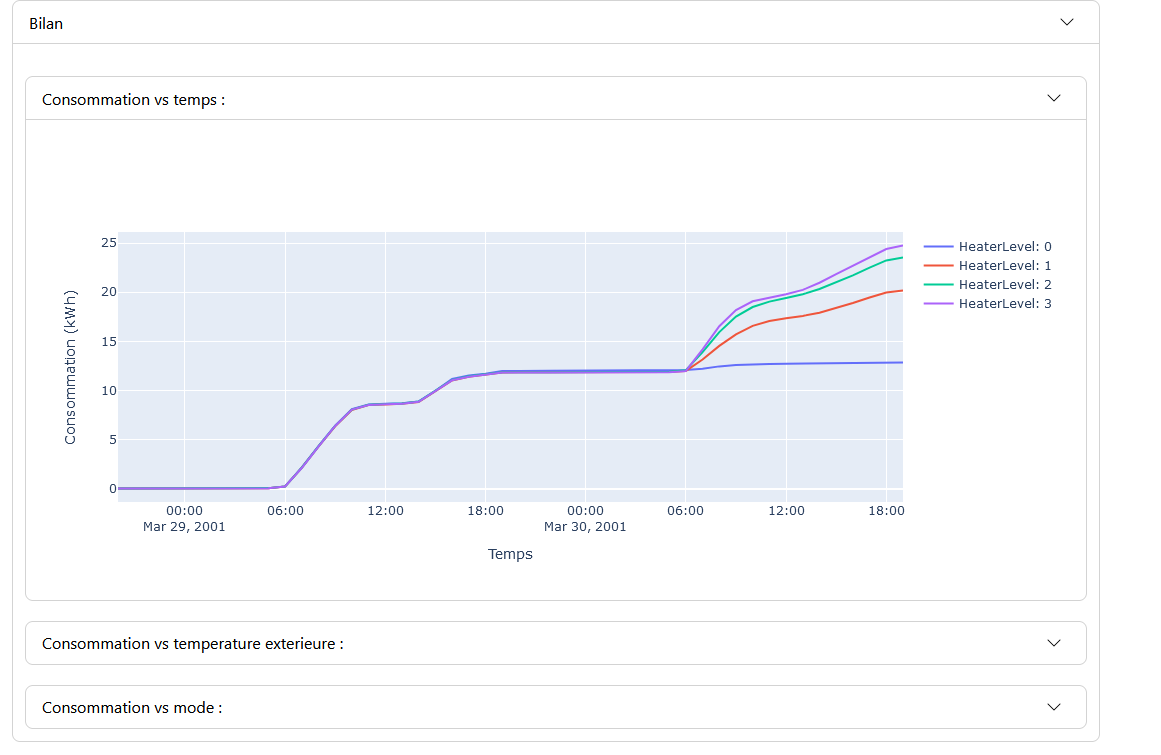
Summary Panel
In the summary panel, different graphs are displayed depending on the chosen study. These graphs highlight the links and impacts between the variables. When the slider values are modified, the results of the graphs change accordingly.
Comparison with Other Features
Unlike other features, there are fewer options available (no selection choices for date/period or variables). In the context of a demo web app, these choices are determined by the study’s parameter file.