Forecast Simulation
We will explore the developments made for the “Forecast Simulation” section.
The implementation of the forecasting feature was done in the same manner as the other functionalities: creating the layout, defining the callbacks, and setting up the associated container. This approach was applied to all new features.
This feature aims to present the different models available for predicting variables such as temperature, pressure, power, etc. The models are trained on data from Technilog sensors, clients, or artificial sources. The feature includes two tabs:
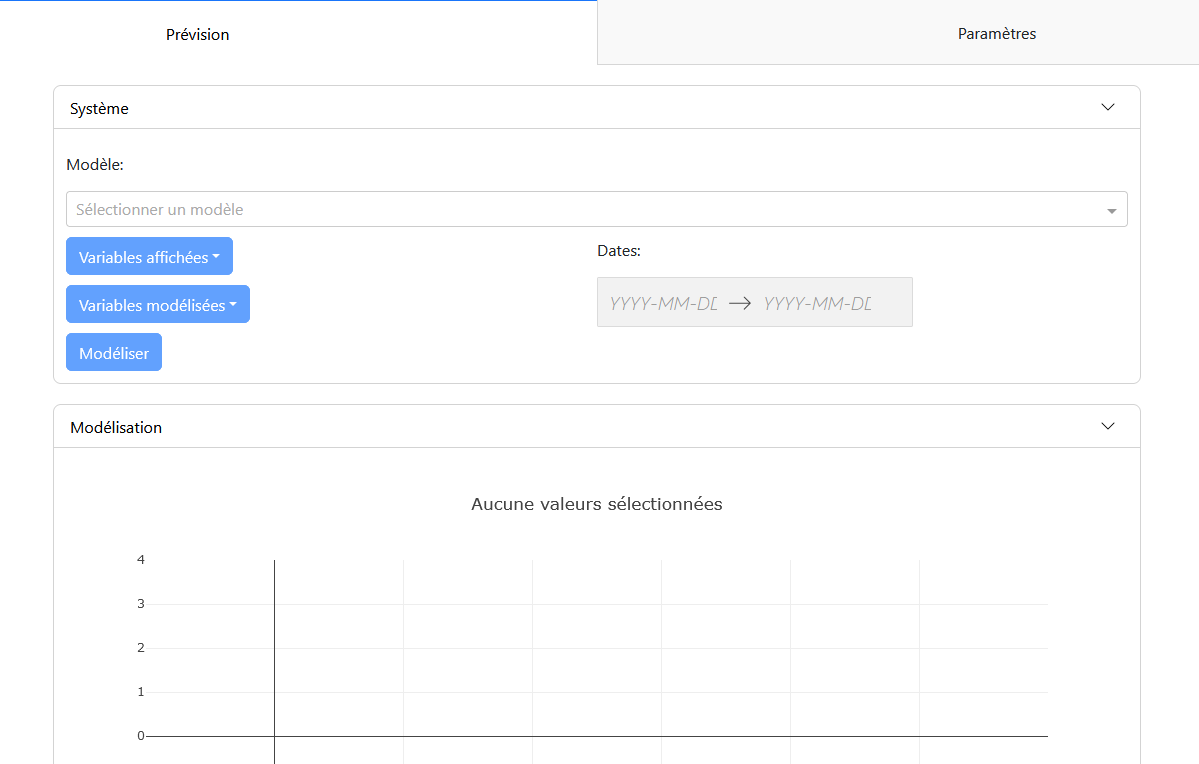
- Forecast Tab: This tab contains the configuration panel “System” and the modeling panel “Modeling.”
- Configuration Panel: Allows for selecting the modeling parameters, such as the model, input variables, variables to display, variables to model, and the study period. Once the variables are selected, it is possible to perform the prediction and visualize the modeling.
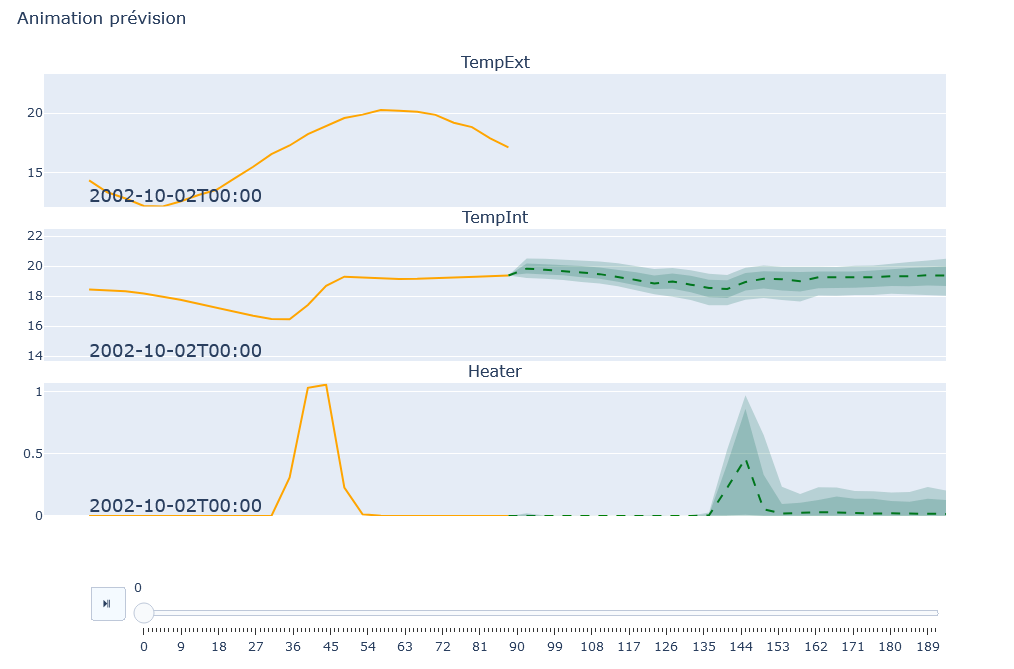
- Modeling Panel: Displays the modeling graphs for each variable. The graphs show the actual data in orange and the predictions with uncertainty in green. Control buttons allow managing the animation, if this option is enabled.
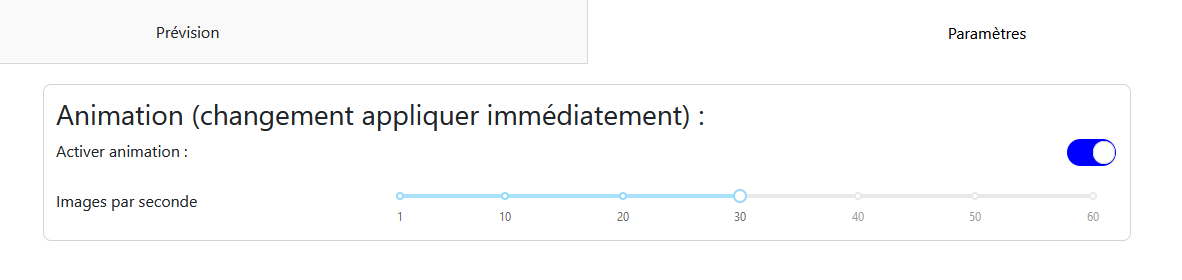
- Settings Tab: Contains the parameters for the modeling animation, such as enabling the animation and the number of frames per second. These options are saved and applied to all models in the feature.