System Anomaly Detection
For system anomaly detection, three tabs are available: “Real-time,” “Historical,” and “Settings.” The “Real-time” and “Historical” tabs correspond to different use cases of the feature.
“Real-time” Tab
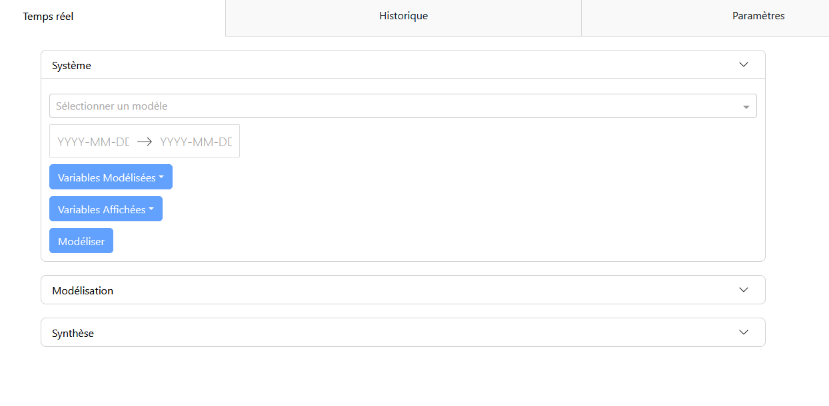
In the “Real-time” tab, you will find the configuration panels “System,” modeling “Modeling,” and summary “Summary.”
Configuration Panel: Allows you to select the model, modeled variables (variables monitored to determine anomalies), displayed variables (variables visible in the modeling panel), and the measurement period (start and end dates). Default values exist depending on the selected model.
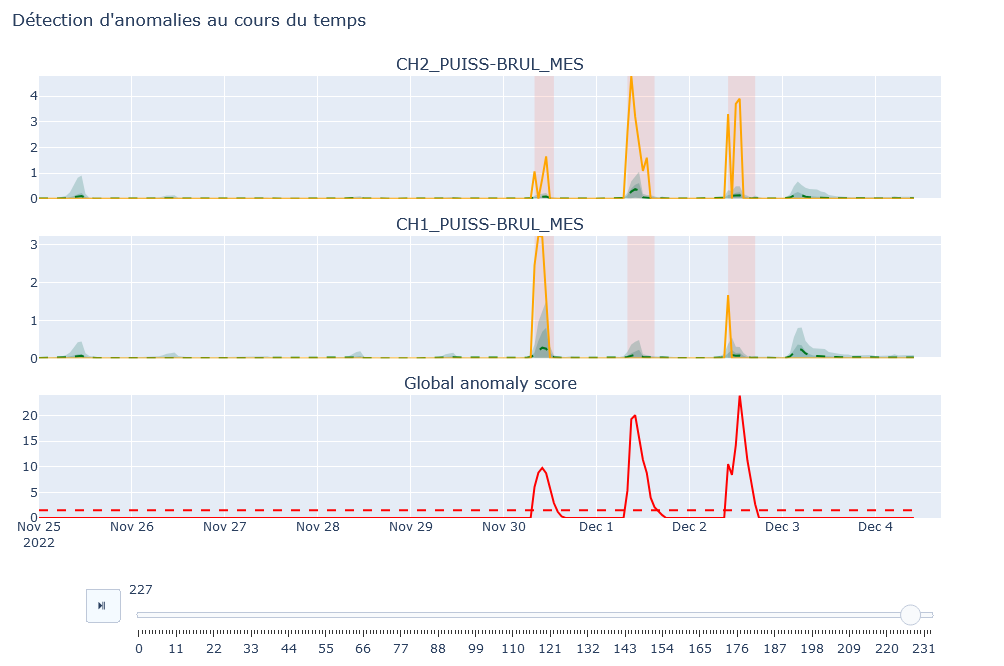
Modeling Panel: Displays graphs of the selected values with their models. If the anomaly threshold is enabled in the “Settings” tab, a graph of the anomaly score is also displayed, highlighting areas where the score exceeds the threshold.
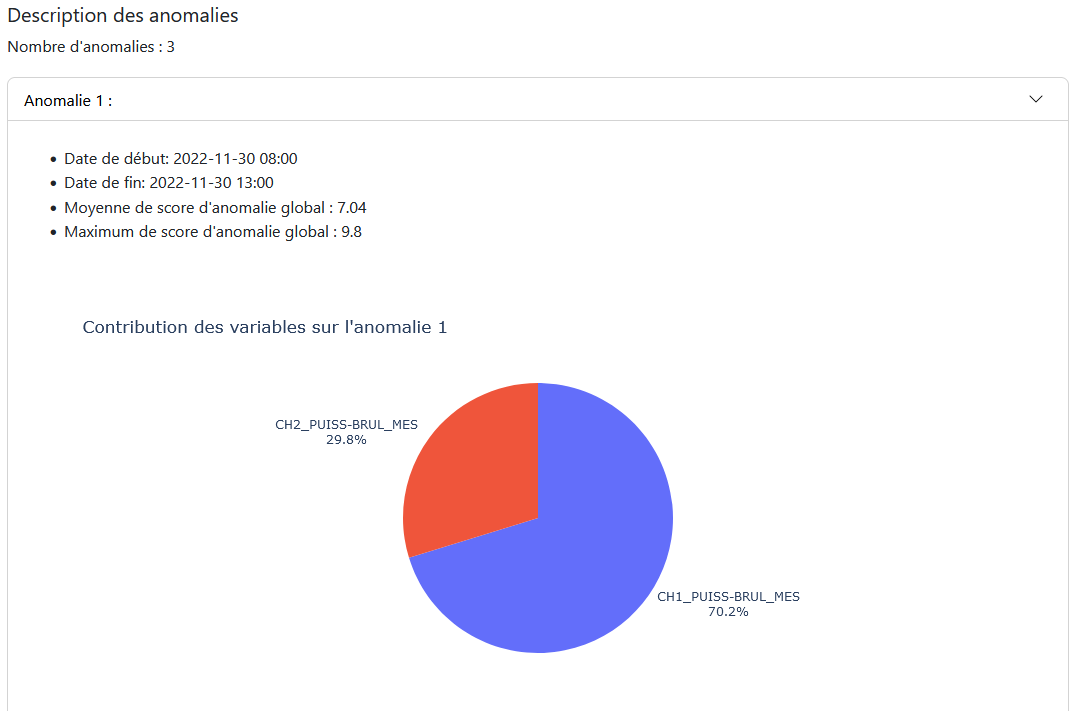
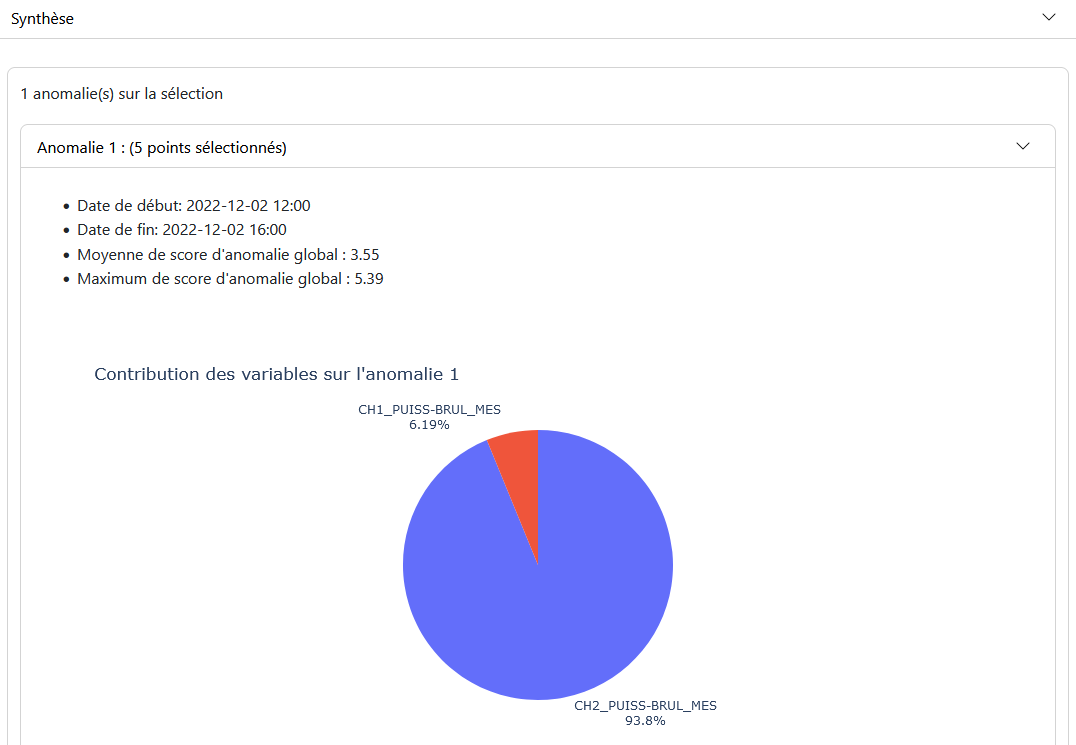
- Summary Panel: Provides a description of the anomalies over the given period and the contribution of the modeled variables to these anomalies.
“Historical” Tab
In the “Historical” tab, you will also find the configuration panels “System,” modeling “Modeling,” and summary “Summary.”
Configuration Panel: Similar to the “Real-time” tab with the same choices. Allows you to choose the model, modeled variables, and displayed variables. Unlike the “Real-time” mode, there is no period selection, as the analysis covers the entire period of available data.
Modeling Panel: Displays results based on the selected parameters. The user can select a specific period by clicking and holding on the obtained model.
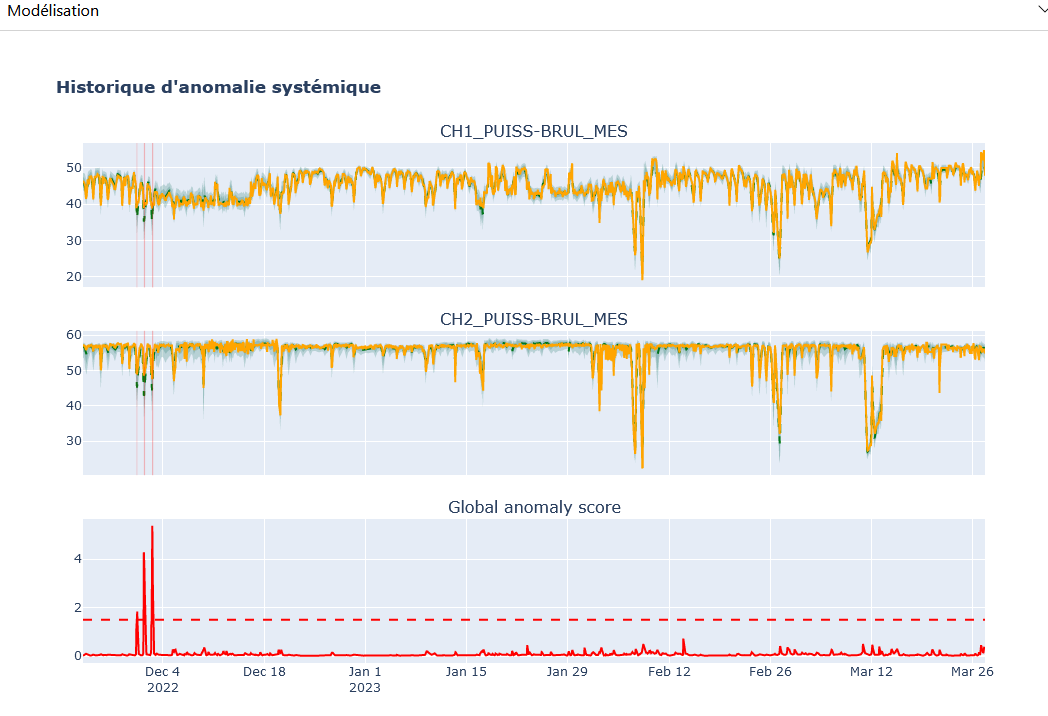
- Summary Panel: Displays the results of anomalies for the selected period, with descriptions of the anomalies and the contribution of the modeled variables.
“Settings” Tab
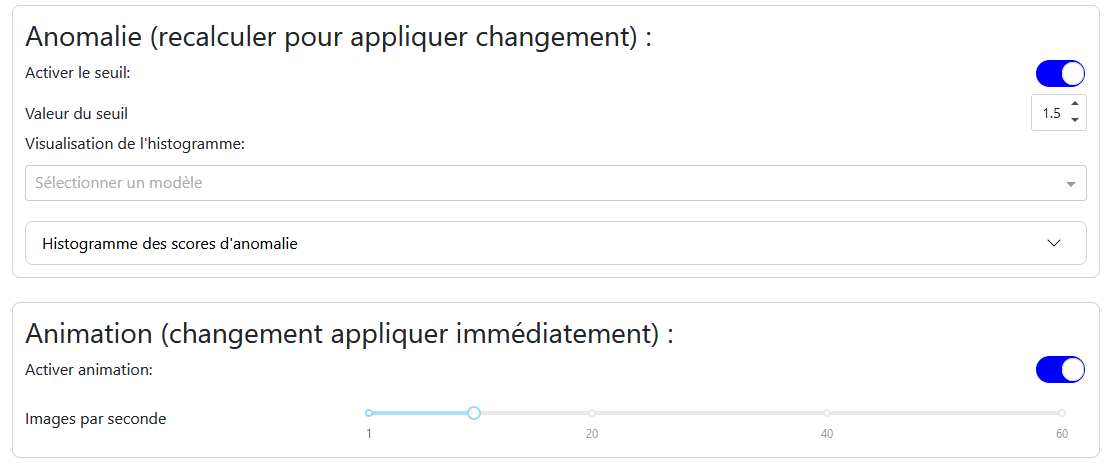
Anomaly: Allows you to enable the anomaly threshold and set its value. A histogram of anomaly scores helps determine the optimal threshold value.
Animation: Allows you to enable or disable the animation and choose the number of frames per second.